Home Health Agency Utilization Trends 2014-2023
CAHSAH has recently analyzed data from the 2023 Annual Utilization Report of Home Health Agencies/Hospices compiled by the California Department of Health Care Information and Access (HCIA). Overall, the number of visits and unduplicated patients continues to increase from prior years.
We have added the 2023 data to our series dating back to 1996 which allows us to look at ten-year trends (2014-2023) for California’s home health industry. Hospice data are not reflected in this analysis but will be analyzed in next month’s Bulletin. The data in this analysis include licensed home health agencies and licensed home health agencies with hospices. They do not include data for organizations which are not licensed as home health agencies such as home care aide organizations.
Home Health Agencies
In 2023, HCIA listed a total of 2702 home health agencies. This does not include 599 agencies which were listed as non-responders, and 89 agencies that closed. Of the agencies listed, 2666 were home health agencies only, and 36 were home health agencies with hospices. Of the 2702 home health agencies, 2271 reported at least one visit. Out of the total number of home health agencies, 2636 reported as parent locations and 66 as branches. In terms of certification status, 1690 were certified as Medicare and Medi-Cal, 111 for neither, 546 for Medicare only and 26 for Medi-Cal only. The overall number of home health agencies increased by 4% from 2022. The number of agencies that are Medicare/Medi-Cal certified showed an 11% increase since 2022.
Unduplicated Patients
The number of unduplicated patients (each patient is counted only once regardless of how many times they were admitted during the year) was 997,762. As shown in Table 1, the number of unduplicated patients has increased 26% since 2014; and increased 3% from 2022.
Table 1
California Home Health Agencies and Patients, 2014-2023
|
Year |
2014 |
2015 |
2016 |
2017 |
2018 |
2019 |
2020 |
2021 |
2022 |
2023 |
|
Agencies w/ visits |
1,434 |
1451 |
1474 |
1489 |
1549 |
1649 |
1748 |
1848 |
2087 |
2271 |
|
Unduplicated Patients |
792,920 |
828,529 |
849,603 |
872,704 |
888,071 |
903,164 |
895,202 |
935,012 |
971,409 |
997,762 |
|
Unduplicated Patients/Agency |
553 |
571 |
576 |
586 |
573 |
548 |
512 |
506 |
465 |
439 |
Source: Annual Utilization Report of Home Health Agencies, California Department of Health Information and Access
Visits
The total number of home health agency visits reported in 2023 was 19,493,867 which represents a 4% increase from 2022. Over the ten-year period, visits have increased 31% since 2014. In 2023, the agency with the largest number of total visits made 320,465 visits. Of the agencies which made at least one visit, the average number of total visits was 8,584. The Annual Utilization Report also collects the number of home care hours. In 2023, 146 agencies reported at least one hour of home care services. The agency with the largest number of home care hours reported 1,794,778 hours. Of the agencies reporting home care hours, the average number of hours was 85,677 for 2023 representing an increase of 25% from 2022.
Table 2
Visits Per Patient, 2014-2023
|
Year |
2014 |
2015 |
2016 |
2017 |
2018 |
2019 |
2020 |
2021 |
2022 |
2023 |
|
Unduplicated Patients |
792,920 |
828,529 |
849,603 |
872,704 |
888,071 |
903,164 |
895,202 |
935,012 |
971,409 |
997,762 |
|
Visits |
14,886,155 |
15,620,451 |
15,659,739 |
16,220,712 |
17,028,040 |
1,7820,055 |
17,608,707 |
18,425,426 |
18,759,733 |
19,493,867 |
|
Visits/ Unduplicated Patient |
18.8 |
18.9 |
18.4 |
18.6 |
19.1 |
19.7 |
19.7 |
19.7 |
19.3 |
20 |
Source: Annual Utilization Report of Home Health Agencies, California Department of Health Information and Access
Visits by Source of Payment
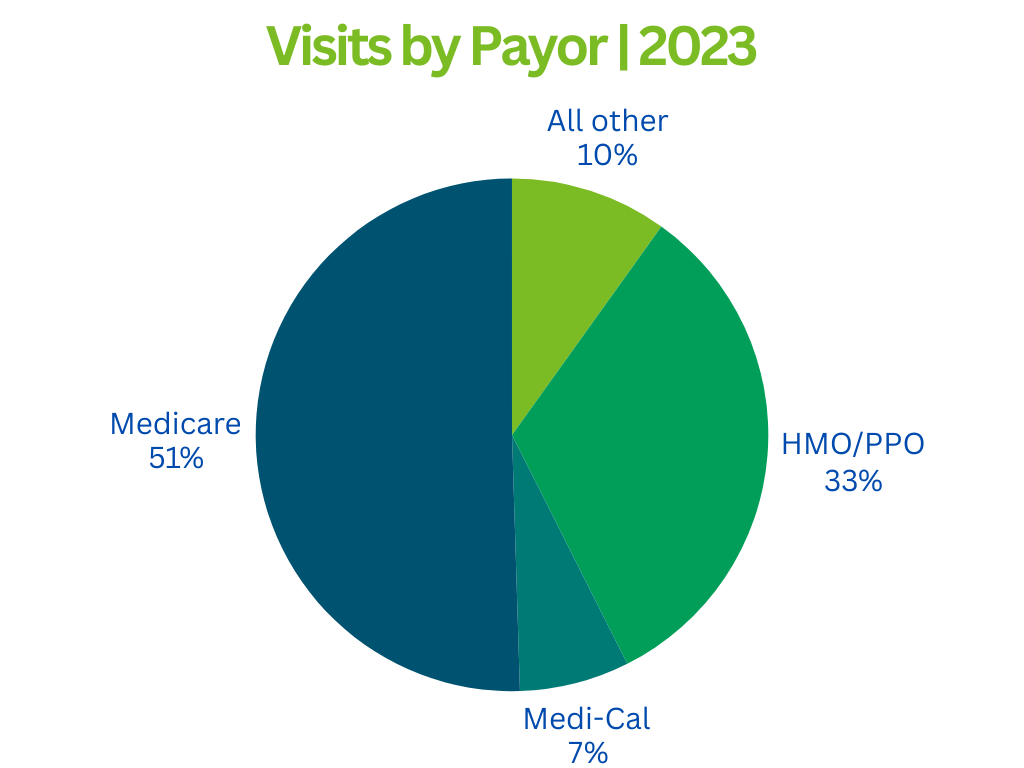
In 2023, Medicare was the greatest source of payment with 51% percent of all visits. HMOs/PPOs followed with the second highest percentage of visits at 33%. Medi-Cal accounted for 7% of all visits, while all other payor sources accounted for the remaining 10%. See Chart 1. In 2023, the agency with the largest number of Medicare visits made 68,310 visits. Of the agencies which made at least one Medicare visit, the average number of Medicare visits made was 4,736. The agency with the largest number of Medi-Cal visits made 275,530 Medi-Cal visits. Out of the total number of agencies, 493 agencies made at least one Medi-Cal visit, while 655 agencies did not make any Medi-Cal visits. Of the agencies reporting Medi-Cal visits, the average number of Medi-Cal visits was 2,750 which represents a 14% decrease in the average Medi-Cal visits since 2022. The payor source overall distribution changed since 2022 with Medi-Cal decreasing its share of the distribution by 2% and HMO/PPOs increasing its share of the distribution by 2 percent.
Chart 1

Over the ten-year period, Medicare visits have increased by 16%. HMO/PPO visits continue to show the greatest increase over the ten-year period with an increase of 111%. Medi-Cal visits still show a decrease since the ten-year period with a 26% decrease from 2014.
Table 3
Visits by Payor 2014-2023
|
Year |
2014 |
2015 |
2016 |
2017 |
2018 |
2019 |
2020 |
2021 |
2022 |
2023 |
|
Total Visits |
14,886,155 |
15,620,451 |
15,659,739 |
16,220,712 |
17,028,040 |
17,820,055 |
17,608,707 |
18,425,426 |
18,759,733 |
19,493,609 |
|
Medicare |
8,495,314 |
8,880,057 |
9,293,701 |
9,539,352 |
10,146,302 |
10,381,343 |
9,162,730 |
9,323,501 |
9,504,272 |
9,889,675 |
|
Medi-Cal |
1,820,964 |
1,721,071 |
1,162,725 |
1,123,853 |
934,414 |
1,144,653 |
1,456,973 |
1,663,326 |
1,712,352 |
1,355,986 |
|
HMO/PPO |
3,012,564 |
3,476,115 |
3,689,105 |
3,977,135 |
4,421,372 |
4,541,435 |
4,950,419 |
5,562,101 |
5,706,371 |
6,341,974 |
|
All Other |
1,557,313 |
1,543,208 |
1,514,208 |
1,580,372 |
1,525,952 |
1,752,624 |
2,038,585 |
1,876,498 |
1,836,738 |
1,905,974 |
Source: Annual Utilization Report of Home Health Agencies, California Department of Health Information and Access
Visits by Discipline
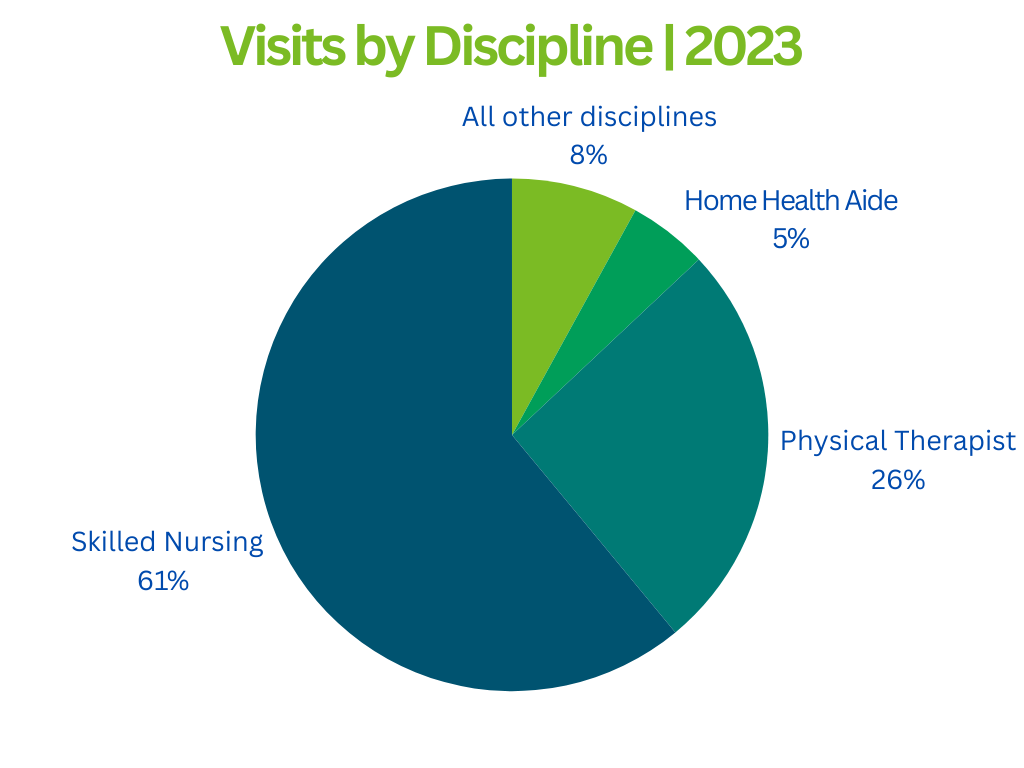
In 2023, 61% of all visits were skilled nursing visits. The next greatest proportion of visits was physical therapy visits, accounting for 26% of the total visits. Certified home health aide visits represented 5% of overall visits. All other disciplines (occupational therapy, social worker, etc.) accounted for the remaining 8% of visits. The ten-year trend for skilled nursing visits shows a 21% increase since 2014. Physical therapy visits increased by 51% over the ten-year period and certified home health aide visits increased by 31% since 2014.
Chart 2

Table 4
Visits by Discipline, 2014-2023
|
Year |
2014 |
2015 |
2016 |
2017 |
2018 |
2019 |
2020 |
2021 |
2022 |
2023 |
|
SN |
9,713,227 |
9,988,074 |
9,687,144 |
9,873,376 |
10,074,330 |
10,397,287 |
11,097,711 |
11,395,993 |
11,458,370 |
11,798,055 |
|
CHHA |
771,559 |
819,910 |
842,689 |
838,897 |
892,994 |
1,009,665 |
867,195 |
885,209 |
929,000 |
1,007,507 |
|
PT |
3,384,377 |
3,668,516 |
3,911,342 |
4,239,199 |
4,630,239 |
4,873,557 |
4,258,345 |
4,645,820 |
4,840,699 |
5,099,592 |
|
All Other |
1,016,992 |
1,143,951 |
1,218,564 |
1,269,240 |
1,430,477 |
1,539,546 |
1,385,456 |
1,498,404 |
1,531,664 |
1,588,713 |
|
Total |
14,886,155 |
15,620,451 |
15,659,739 |
16,220,712 |
17,028,040 |
17,820,055 |
17,608,707 |
18,425,426 |
18,759,733 |
19,493,867 |
Source: Annual Utilization Report of Home Health Agencies, California Department of Health Information and Access
Admissions by Source
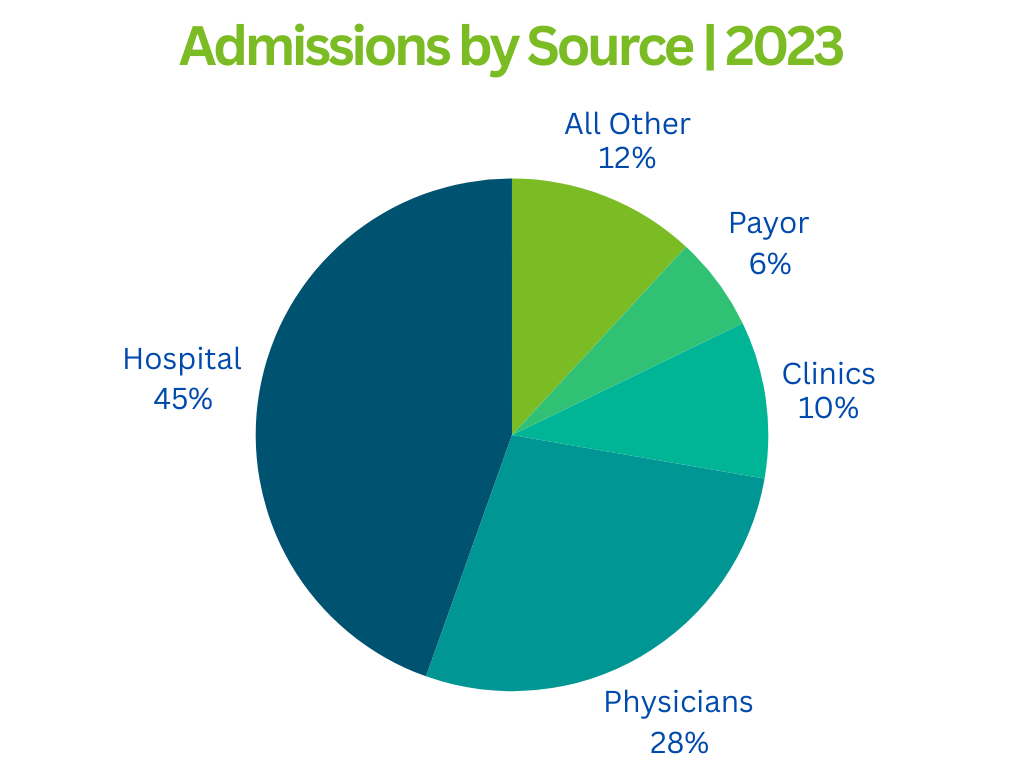
In 2023, 45% of home health agency admissions came from hospitals. Physicians accounted for 28% of admissions while clinics accounted for 10% and payors represented 6%. The remaining 12% of admissions came from all other sources. Admissions from hospitals decreased it’s share of the overall distribution by 2% and payors increased its share by 2%.
Chart 3

Discharges by Reason
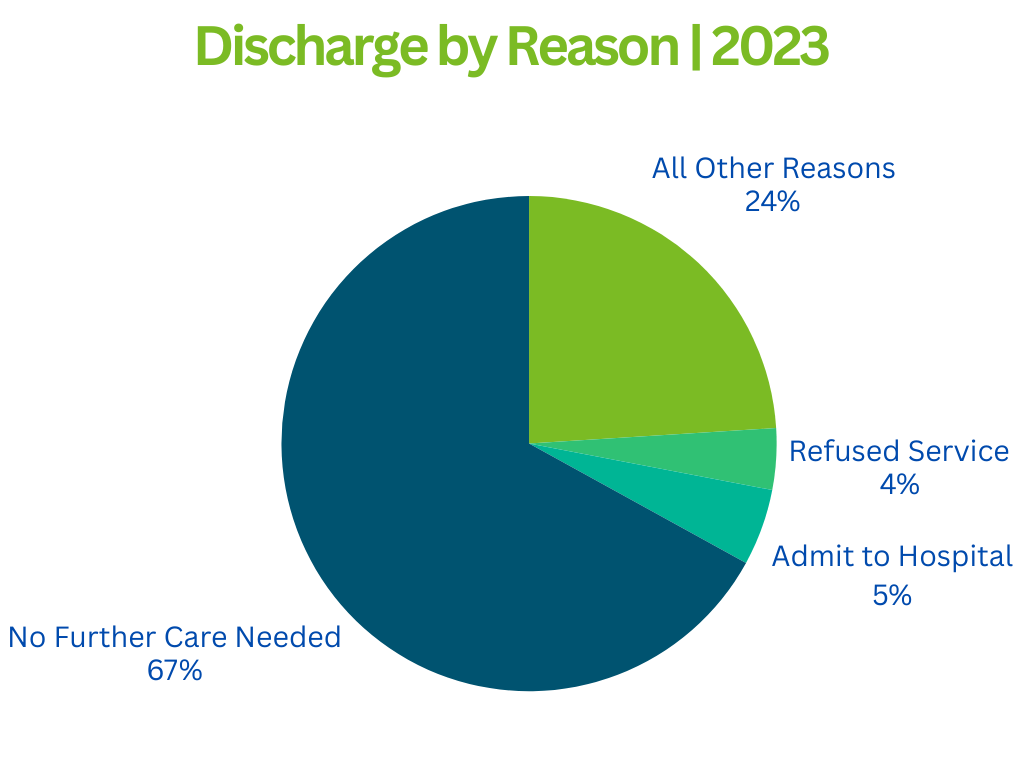
In 2023, the most prevalent reason for discharge was “No further care needed” which represented 67% of the cases. Discharges to hospitals accounted for 5% of the overall discharges and refused service represented 4% of the overall reasons for discharge. All other reasons for discharge accounted for the remaining 24% of cases. See Chart 4. The overall distribution of reasons for discharge showed only a slight change compared to 2022 with “refused service” decreasing one percent and “all other reasons” for discharge increasing its share of the distribution by two percent.
Chart 4

